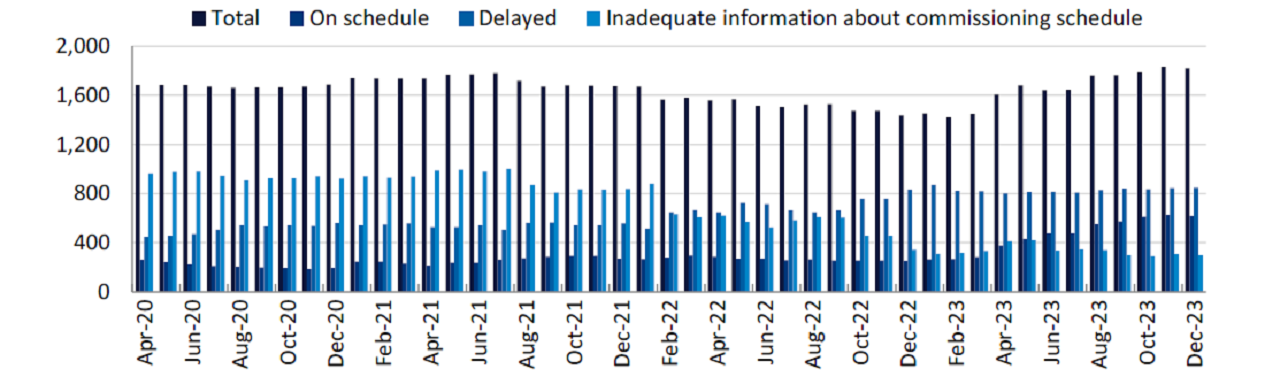
According to the Infrastructure and Project Monitoring Division of the Ministry of Statistics and Programme Implementation, as of 1 January 2024, it was managing a pipeline of 1,820 projects with an anticipated completion cost of Rs30.7tn ($315bn).
Of the total, it had 1,253 ‘major’ projects worth Rs5.6tn, and 567 ‘mega’
projects worth Rs25.1tn.
Access deeper industry intelligence
Experience unmatched clarity with a single platform that combines unique data, AI, and human expertise.
In terms of project implementation status, 56 projects were ahead of
schedule, 618 were on schedule, 848 were delayed while the commissioning schedule of 298 projects was unknown.
Projects in the road transport and motorway sector account for the highest share of projects in the pipeline by volume. More than half the number of pipeline projects (56.1%) are involved in this sector.
This is followed by projects in railways (13.7%), petroleum (8.6%), coal (6.8%), power (5.4%), and water resources (2.3%) sectors, among others.
In terms of project value, as per the original cost of implementation, the road transport and motorway sector again accounted for the highest share.
However, it is a small share of the total – 28.9%, railways (17.2%), and petroleum (15.9%) rank as the second and third largest sectors by project value, followed by urban development (11%) and power (10.2%).
The water resources sector witnessed the highest cost overrun with respect to the original cost of implementation – equivalent to 197%, followed by the railways (50.1%), home affairs (46.1%), and renewable energy (34.7%) sectors.
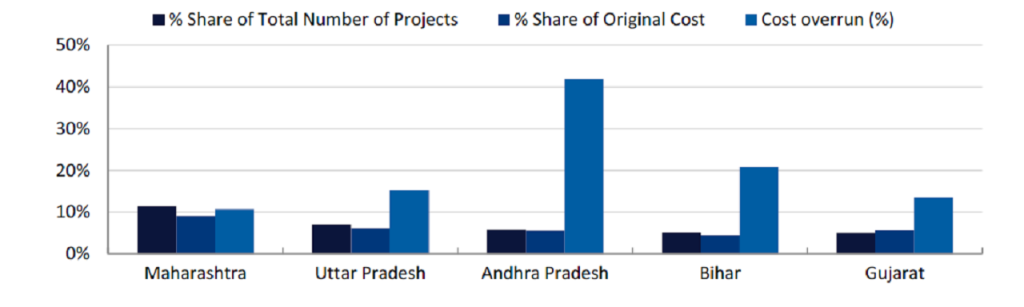
The state of Maharashtra accounts for the largest number of projects in the pipeline – equivalent to 208; this is followed by the states of Uttar Pradesh (127), Andhra Pradesh (105), Bihar (93), and Gujrat (92).
The states that are witnessing the highest cost overruns, with respect to original estimates, include Meghalaya (137%), Mizoram (75.6%), Manipur (66.3%), Jammu and Kashmir (51.7%), Sikkim (48.6%), and Himachal Pradesh (47.8%).
The states which have included the highest cumulative expenditure, as of 1 January 2024, are Puducherry (92.1%), Mizoram (72.4%), Manipur (71.2%), Uttarakhand (70.1%), Delhi (69.7%), and Goa (63.5%).
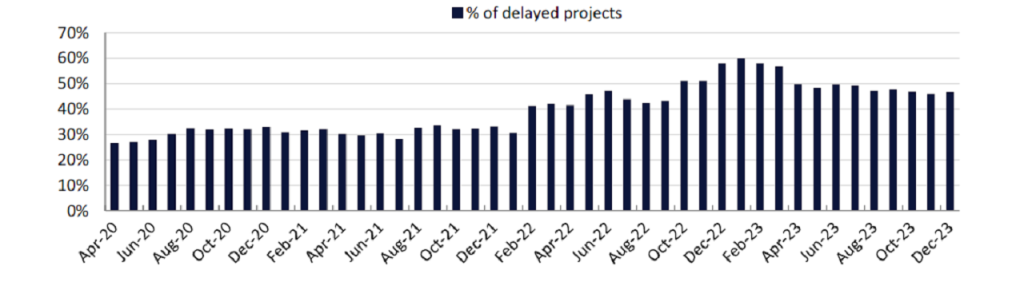
Although project delays have been falling in recent months, it still higher than the 2021 figure.
In December 2023, 46.6% projects delayed. Of the total number of delayed projects in December 2023, 38.1% have been delayed in the range of 25-60 months, 23.8% in the range of 1-12 months, 23.6% in the range of 13-24 months while 14.5% of projects have been delayed over 60 months.
The overall percentage of cost overrun with respect to original estimates is equivalent to 18.7%, at the end of December 2023.
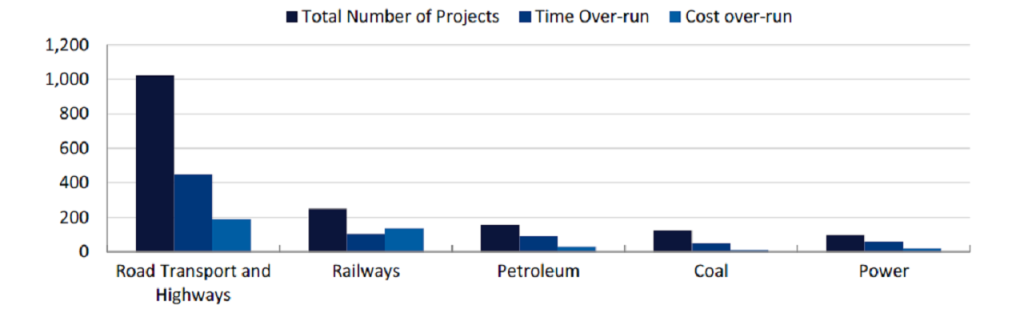
Road transport and motorway projects have the highest number of time and cost overruns.
In December 2023, there were 450 delayed projects while 188 projects are facing cost overruns.
The railways sector has the second highest number of projects with time and cost overruns, equivalent to 105 and 138 projects respectively.
Some of the main reasons for the delay in project implementation are problems with land acquisition, delays in obtaining environmental local authority clearances,
changes in project scope, a lack of infrastructure support, and inadequate labour power.
Cost overruns can be attributed to inflation, changes in foreign exchange rates, underestimation of original costs, spiralling land acquisition costs, and time overruns, among others.
Considering the increase in project delays and a fall in foreign direct investment in the country, the Indian construction industry’s growth is expected to slow from 9.6% in 2022 to 5.3% in 2023, according to GlobalData, a leading data and analytics company.
However, the government’s focus on boosting economic growth by investing in infrastructure development is expected to provide an
impetus to the industry’s growth in 2024.
In the financial year’s 2024/25 (FY24/25) (April 2024 to March 2025) Interim Union
Budget, the government announced a capital expenditure of Rs11.1tn for FY24/25.
This is a 16.8% increase compared to the FY23/24 budget. Of the total capital expenditure for FY24/25, more than half the budget – equivalent to 54.7% – is earmarked for roads, motorways and railways, and the communication sector.
Highlights of infrastructure sector performance
Roads and motorways:
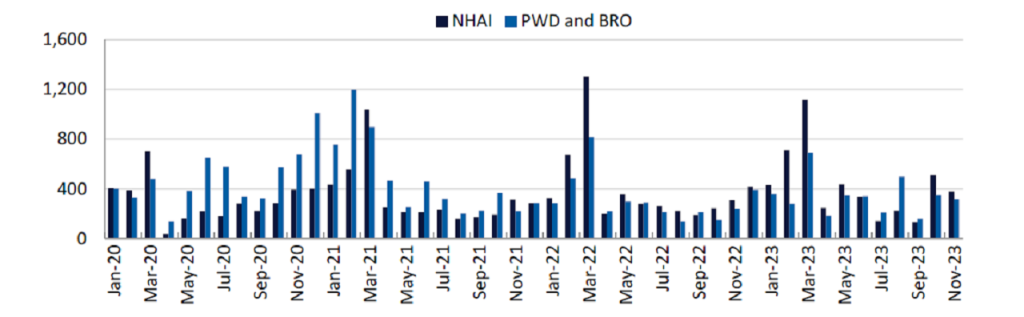
The National Highways Authority of India (NHAI) widened and upgraded 379.1km of motorways in November 2023 (latest data available at the time of writing).
The work completed was 36.6% lower than its target. However, it was 23.5% higher
compared to the work completed during November 2022.
Similarly, the Public Works Department (PWD) and the Border Road Organisation (BRO) widened 92.5km of two/four/six/eight lanes and strengthened 221.6km of existing pavement in November 2023 – marking a 30.4% YoY growth compared to the same period last year.
In cumulative terms, the total length of road network widened and upgraded by the NHAI grew by 7.1% in the first 11 months of 2023, to a total of 4,668.1km by November 2023.
Similarly, the total length of the road network widened and strengthened by the PWD and BRO grew by 11.3% YoY, from 3,348km to 3,725km, during the same period.
Power:
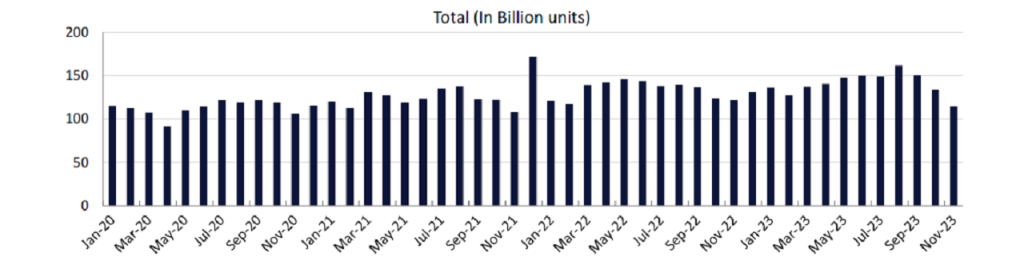
The total power generated in India stood at 114.7 billion units in November 2023 (latest data available at the time of writing).
This marks a YoY 5.8% decline compared with the November 2022. The fall in power generation during November 2023 was due to lower demand for heating equipment, on account of mild winter.
Of the total, 14.1 billion units of power were generated from renewable energy sources, marking a 2.5% YoY growth over the same period of last year.
However, the power generated from renewable energy sources began to slow from August 2023, owing to the supply chain challenges, lower auction volumes and trade policies.
In cumulative terms, the total power generated in the country rose by 5.3% during
the first 11 months of 2023, increasing from 1,471 billion units in January-November 2022 to 1,548 billion units in January-November 2023.
Of the total, power generation from renewable energy sources rose by 17.1%, from 178 billion units to 209 billion units, during the same period.
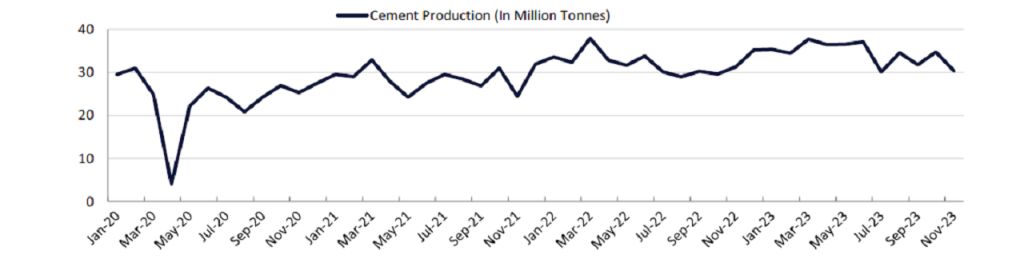
zCement production:
The total amount of cement produced in the country stood at 30.3 million tonnes in November 2023 (latest data available at the time of writing), compared with production of 34.7 million tonnes in October and 31.7 million tonnes in September 2023.
Due to the slowdown in demand amid the festive season and elections in some states, the production of cement fell in November 2023. In annual terms, cement production rose by 12.9% in 2022, increasing from 343.2 million tonnes in 2021 to 387.7 million tonnes in 2022